The Metro Energy Management System is currently one of the construction components of urban rail transit. According to statistics, the energy consumption costs of metros account for more than 30% of total operation costs. Looking at the current energy usage of domestic metros, traction power consumption accounts for approximately 55% of the entire line's electricity usage, while the remaining 45% is for station energy use (including water, gas, oil, and other energy sources). With the increase in metro mileage and the continuous rise in electricity prices, the pressure on energy conservation and the cost of energy consumption faced by metro operations will become increasingly significant. At the same time, the national attention to metro energy consumption is also rising.
Structure of the Metro Energy Management System
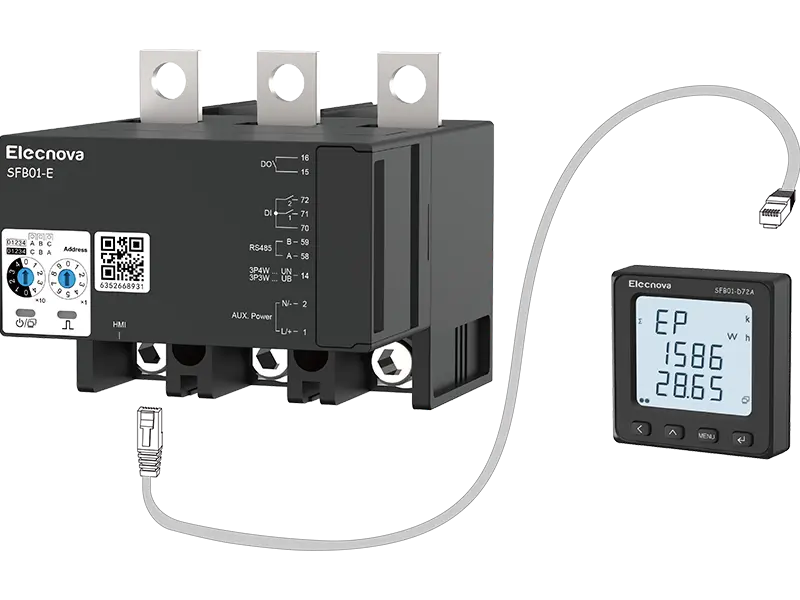
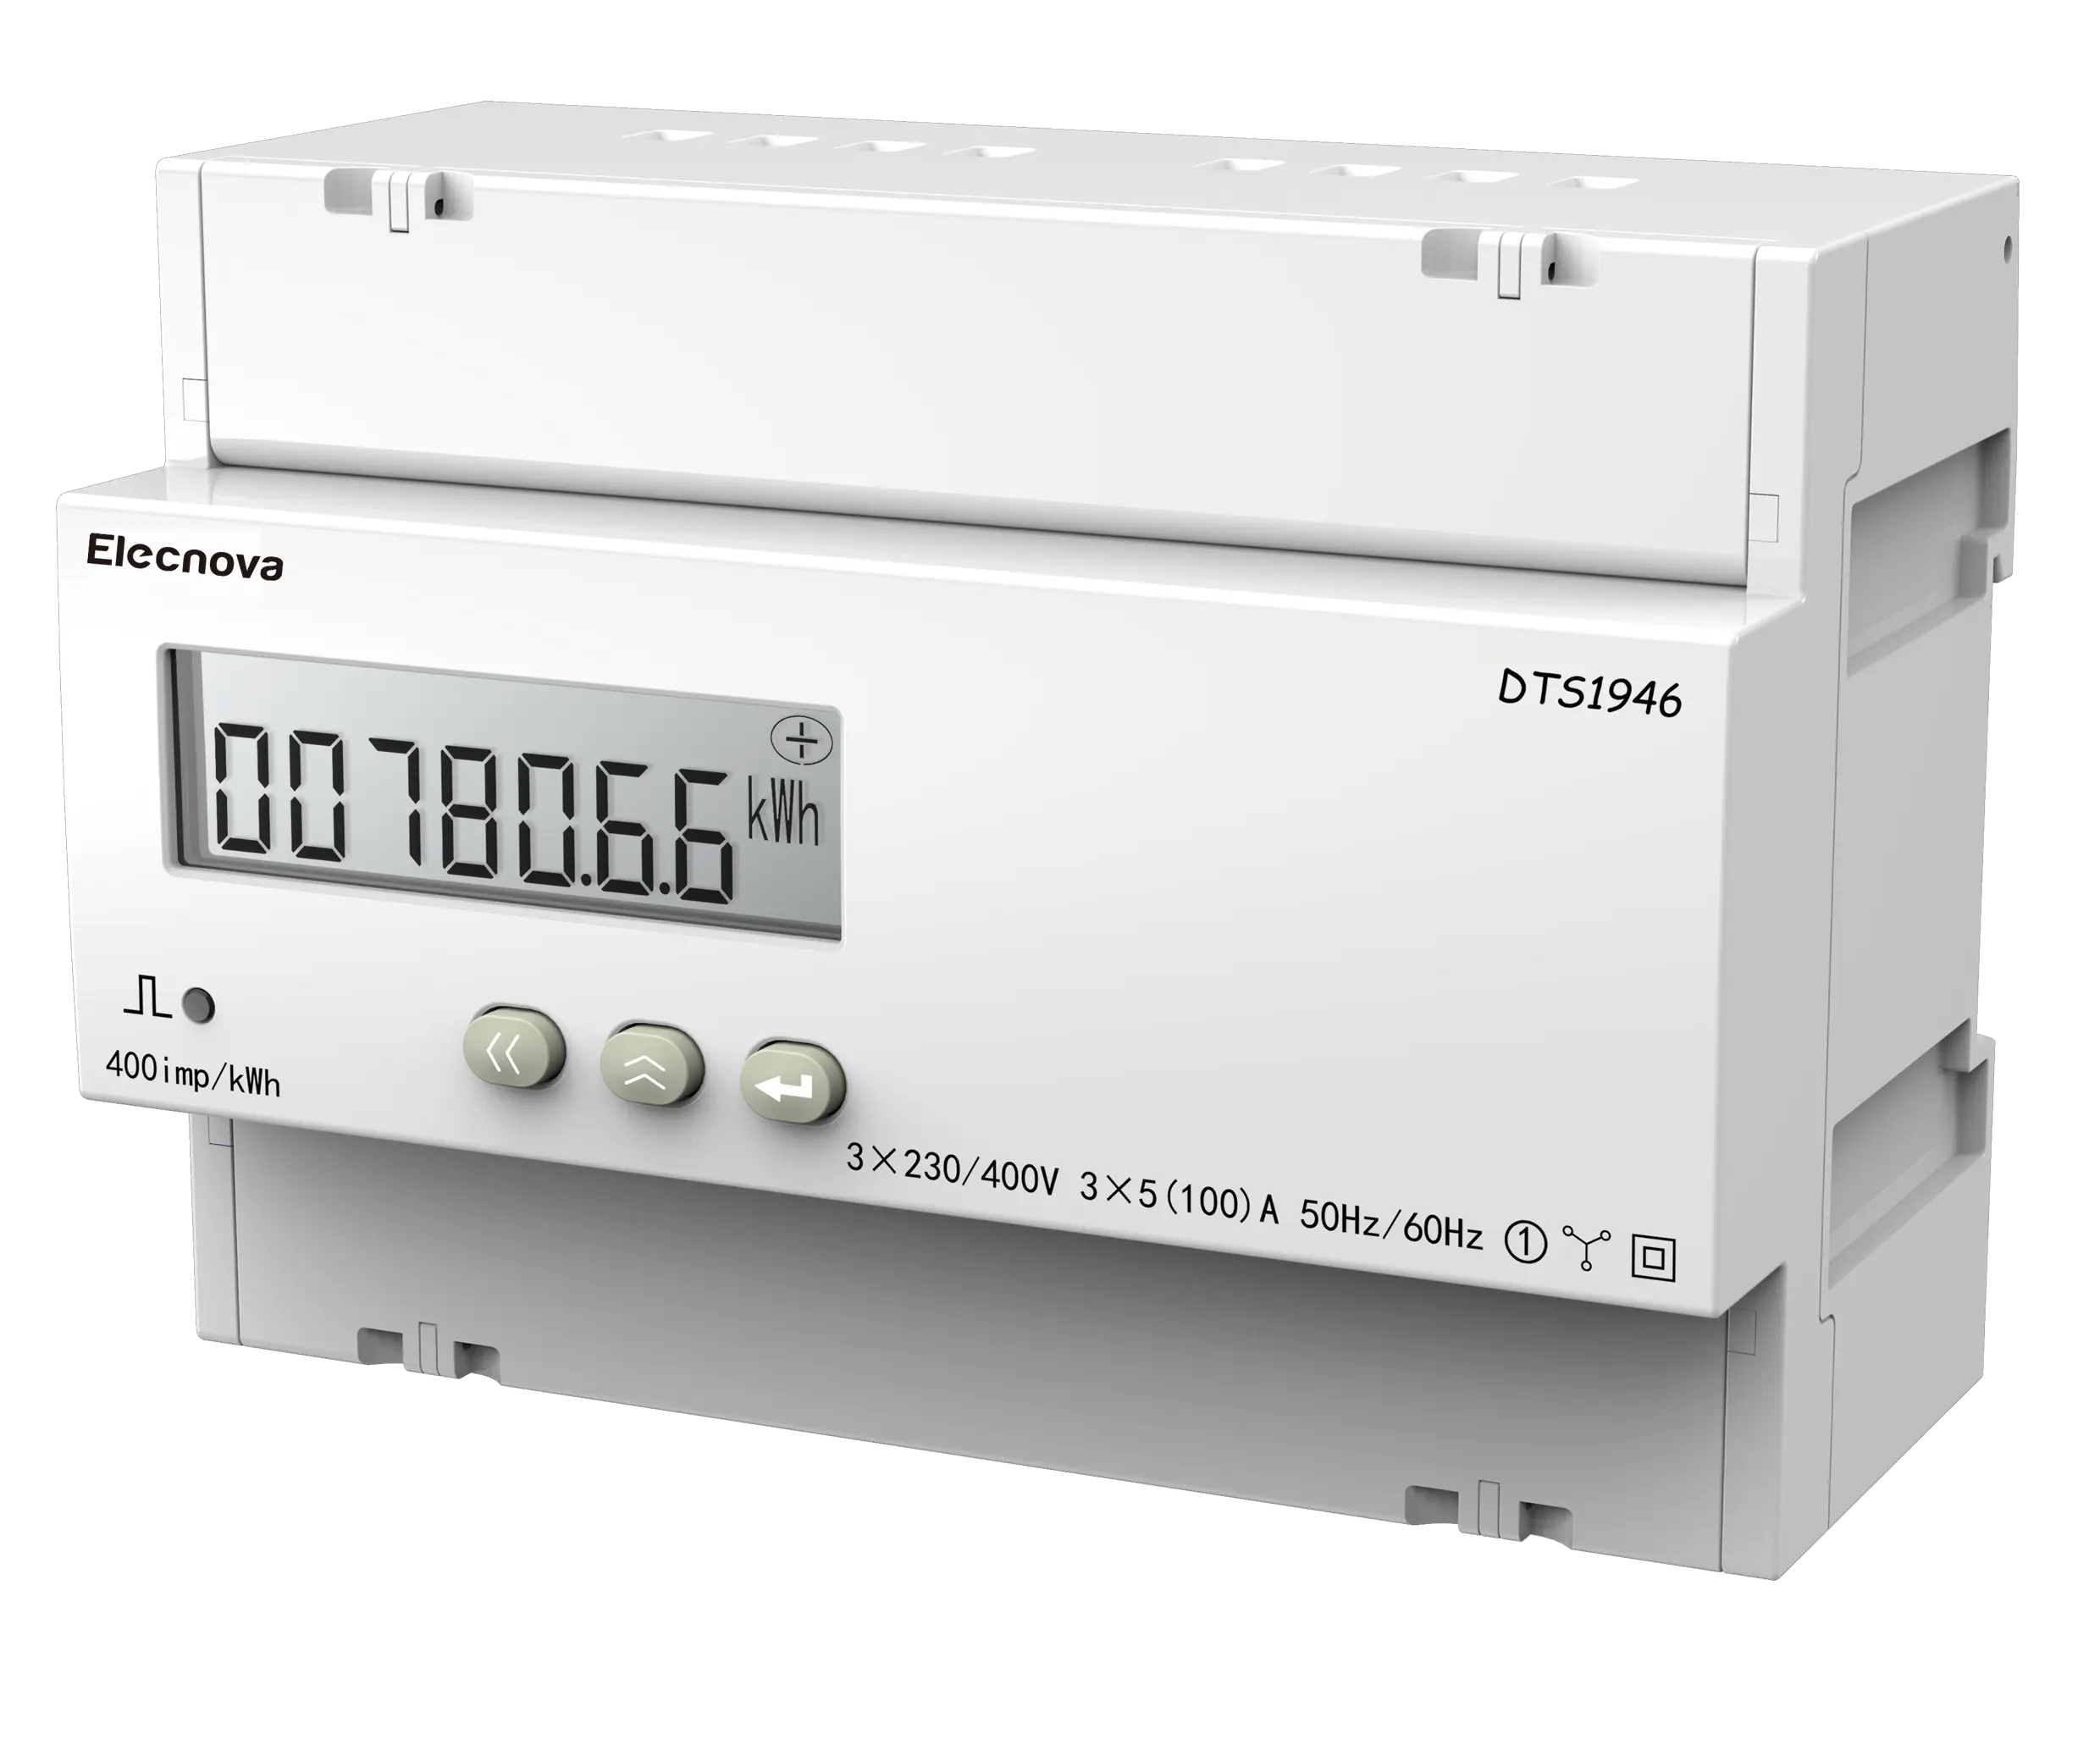
The Metro Energy Management System is based on modern information technologies such as intelligent IoT and big data. By organically integrating metro system energy usage information and power quality information and based on the internal ring network center, it provides functions such as real-time data monitoring, energy usage analysis, power monitoring, power quality analysis, alarm notifications, and asset management. This helps users grasp real-time metro energy usage, achieving the management goals of scientific operation and maintenance, cost reduction, and efficiency improvement. The typical scope of the Metro Energy Management System includes stations, interval sites, vehicle segments/parking lots, main substations, etc. All the 110kV, 35kV, and 400V power supply and distribution systems throughout the line are included. Data from metro-specific multifunction meters installed at each loop are locally collected by S20 gateways in the stations and uploaded through an independent network channel assigned to the energy management system on the metro backbone network to the control center's energy management server.
Functions of the Metro Energy Management System
Home Dashboard
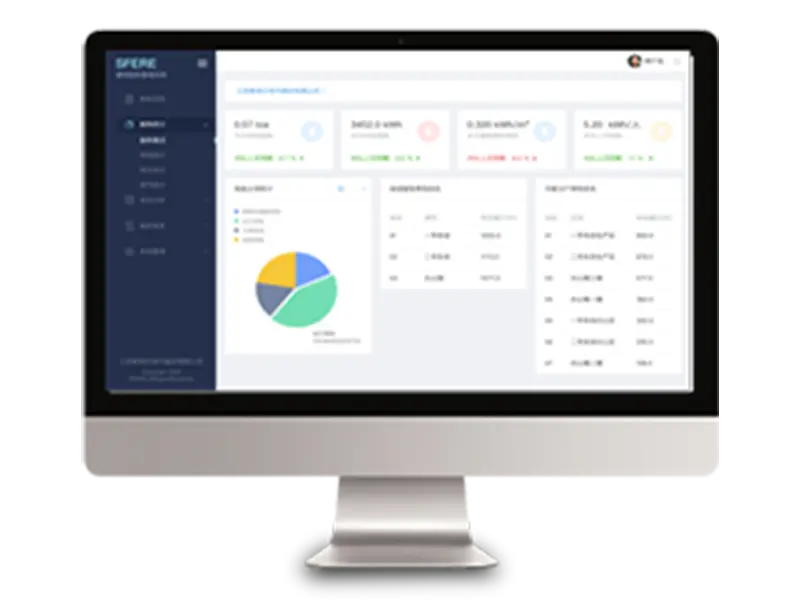
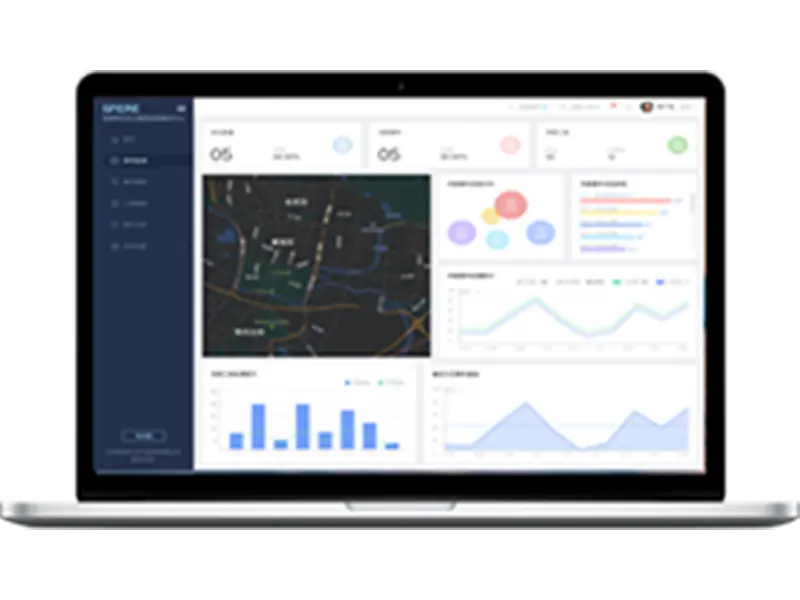
It provides a centralized display of the total energy consumption data for the entire line in the form of pie charts, bar charts, line graphs, comparison charts, tables, etc.
Classified and Sub-itemized Energy Measurement
Based on the characteristics of metro electricity usage, sub-itemized measurements are conducted for traction electricity, power electricity, lighting electricity, commercial electricity, etc., by layers such as stations, interval sites, control centers, vehicle segments, parking lots, and main substations.
Metro Energy Consumption Evaluation Indicators
By calculating and analyzing evaluation indicators of metro energy consumption such as unit energy consumption of station escalators, lighting, air conditioning, line traction power consumption, unit comprehensive energy consumption, line network unit traction power consumption, unit power consumption, and unit comprehensive power consumption.
Metro Professional Reports
The Metro Energy Management System comes with built-in report formats such as traction reports, power lighting reports, main substation reports, and other metro operation management-specific reports. It also allows customized report formats according to actual management needs, enabling one-click export for more efficient daily management.
Comprehensive Monitoring of Power Data
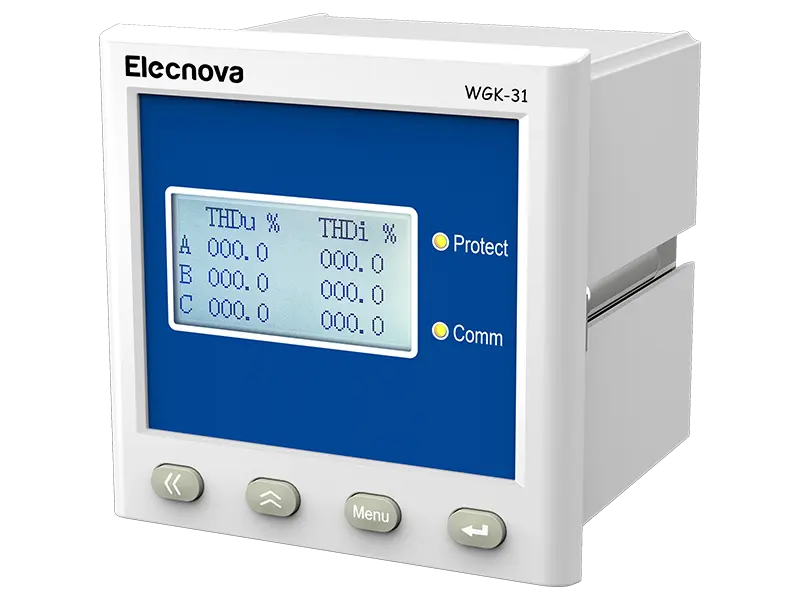
While the Metro Energy Management System conducts real-time monitoring of conventional power parameters, it also monitors the power quality conditions of metros, including three-phase imbalance, harmonic distortion rate, etc., helping users comprehensively control energy usage conditions.


 CN
CN EN
EN
 fr
fr  de
de  es
es  it
it  ru
ru  ar
ar  vi
vi  tr
tr  th
th 


