Summary
With the rapid development of communication industry and the continuous progress of communication technology, the computer room power environment integrated monitoring system of communication enterprises and other transportation, banking, securities, insurance, large industrial and mining, chain enterprises with three major operators as the main body has become an important part of enterprise communication operation and maintenance management. The power supply and distribution design of data center has become a hot issue. Efficient and reliable data center power distribution system scheme, It is an effective way to improve the power utilization efficiency of the data center and reduce the energy consumption of equipment.
The power supply and distribution monitoring system of the IT computer room is a highly safe, stable and reliable monitoring system for the data center computer room that meets the requirements of big data. The system carries out real-time communication interaction with various intelligent environmental equipment at the front end. Through intelligent monitoring, analysis, control, and diversified alarm processing mechanisms and friendly presentation, the operation and maintenance personnel of the data center can timely understand the operation status of power supply and distribution equipment in the data center, greatly reducing the burden on management personnel, and improving the operation efficiency of power distribution in the data center.
Reference standards
GB 50174-2008 Code for Design of Electronic Information System Room
GB 50462-2008 Code for Construction and Acceptance of Electronic Information System Machine Room
GB/T 17215.322-2008 Static Active Energy Meters (Class 0.2S and 0.5S) Data center energy consumption testing standards and implementation rules
GB 50052 Code for Design of Power Supply and Distribution Systems
Configuration scheme
Distribution composition
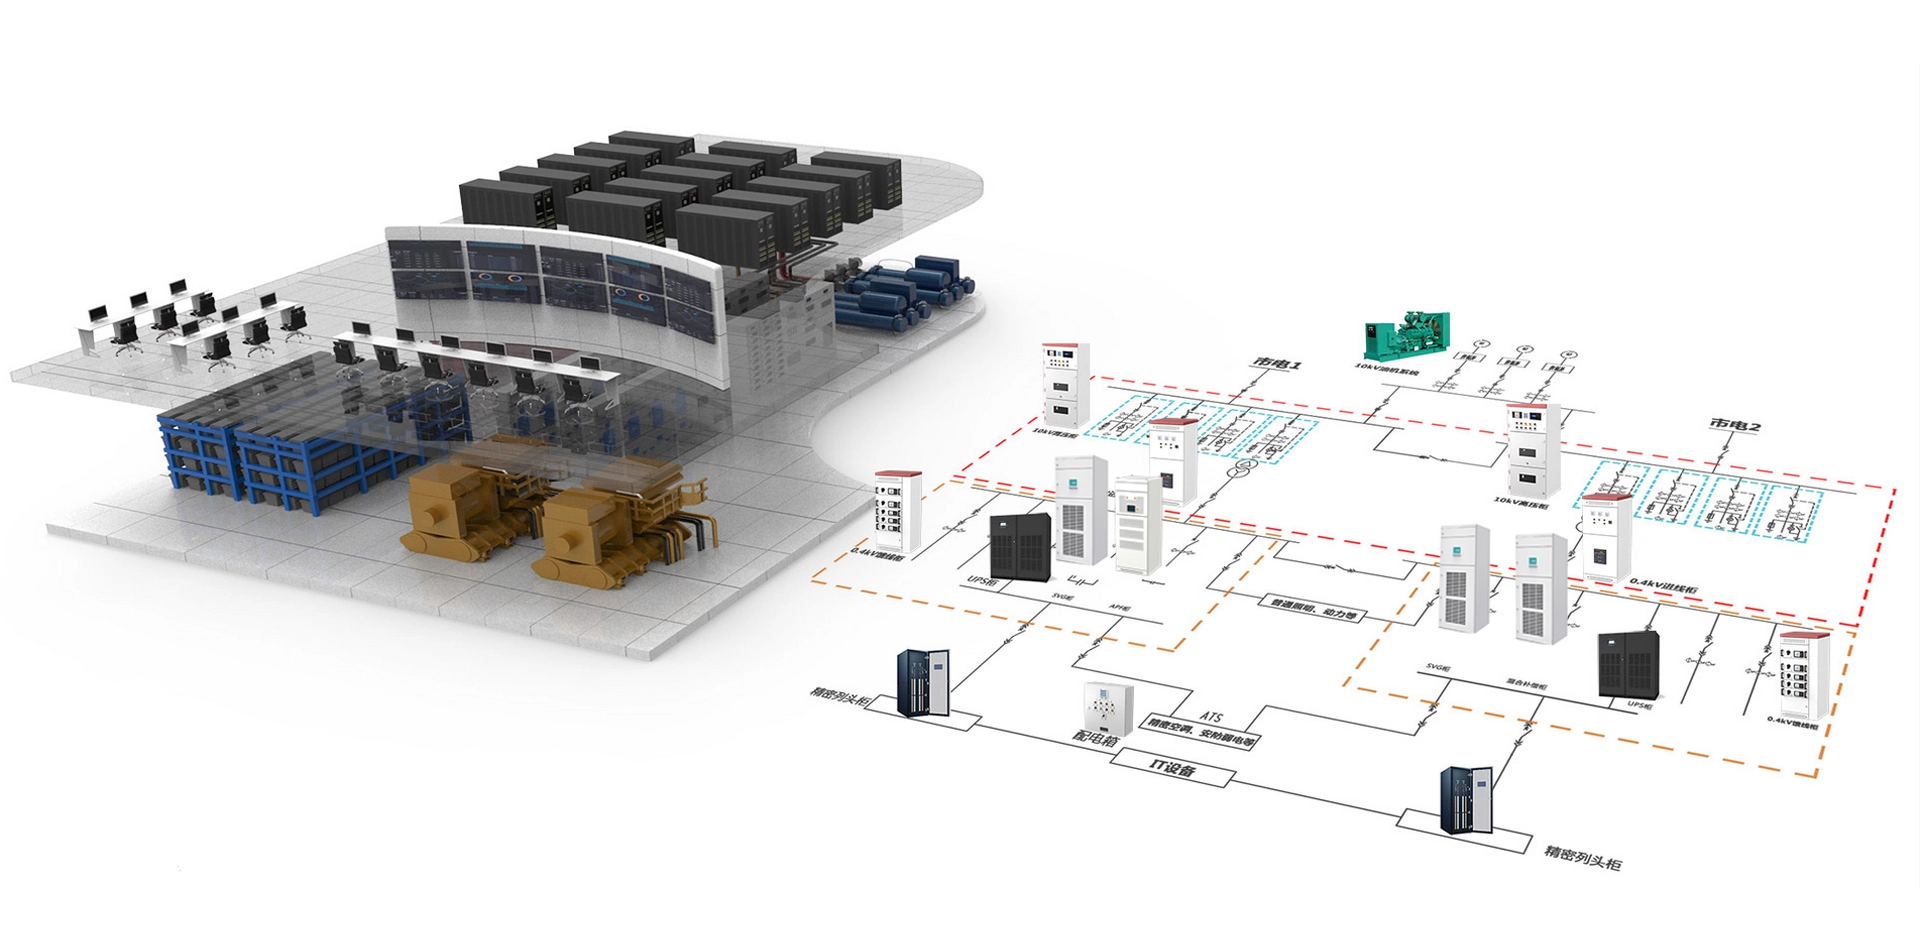
The data center is mainly composed of power transformation and distribution system, power supply and distribution system, UPS system, air conditioning, heating and ventilation, fire protection, security, power environment monitoring system, machine room equipment, machine room lighting, etc.
The perfect power supply and distribution system of the data center has an incomparable important position. Ensure the normal operation of electric equipment in the data center, effectively improve the security capability of the data center, and ensure the safe and reliable operation of the power supply system in the core computer room.
The SFERE data center power monitoring system realizes the power supply and distribution system abnormal alarm through powerful software analysis and statistics functions on the basis of comprehensive collection of power equipment data, equipment energy consumption, event recording, reporting functions, and power quality monitoring, so as to prevent accidents to the greatest extent.
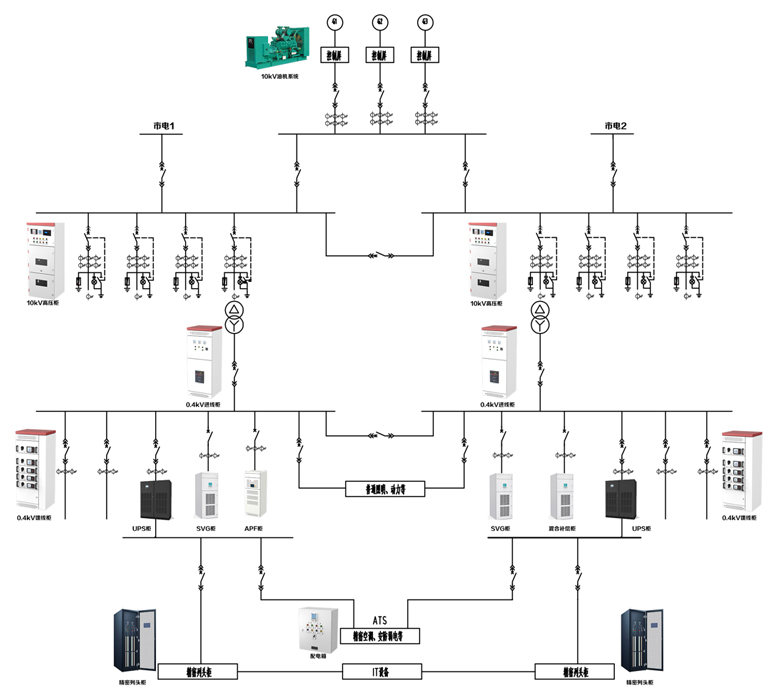
The power of the data center is introduced from two mains supplies (main and standby) and one high-voltage diesel generator (backup) through the high-voltage distribution room. It is supplied to the lower transformer through the high-voltage switch cabinet, fed from the low-voltage distribution cabinet to the UPS cabinet, and distributed to each cabinet PDU through the UPS feeder cabinet to the precision array cabinet of the data center. At the same time, the low-voltage distribution box is introduced from the low-voltage distribution cabinet and UPS feeder cabinet to provide power for precision air conditioning, lighting, security and other equipment in the data center.
Application occasions

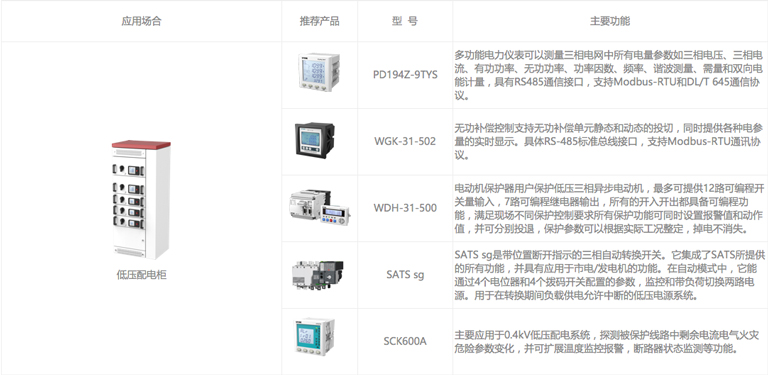

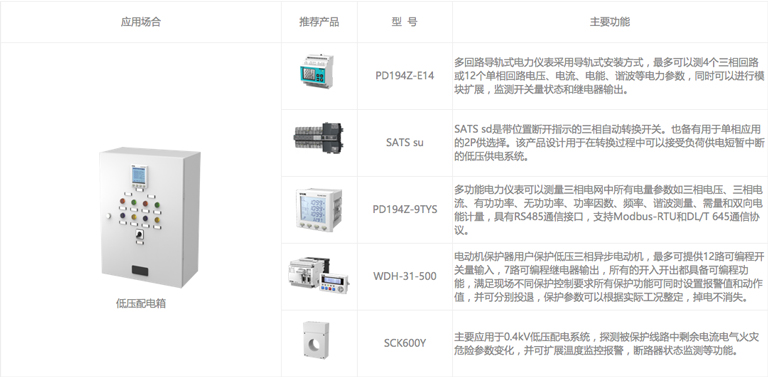
System architecture
The power distribution monitoring system scheme of the data center can realize real-time monitoring, equipment maintenance and control, power quality management, and overall energy cost management of electrical equipment inside and outside the computer room of the data center, improve the real-time and reliability of monitoring, improve the efficiency of energy use, optimize the energy cost, and increase the reliability and effectiveness of the power system.
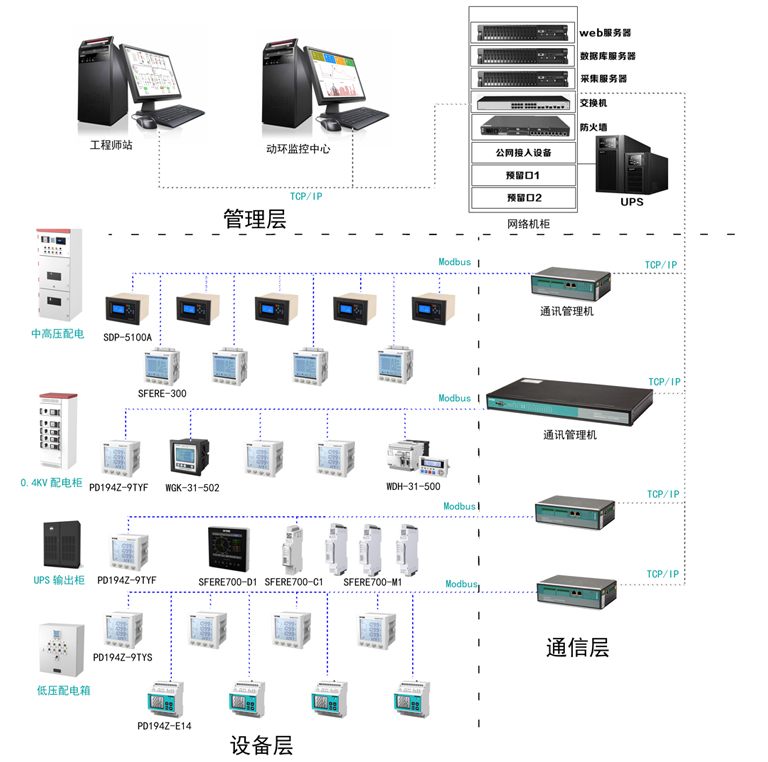
The management is generally located in the management duty room, including the monitoring management computer (server), printer, UPS, timing device, telecontrol device and monitoring management software installed in the monitoring management computer. The management computer can be placed on the operating platform of the duty room or installed in the network cabinet to form a monitoring screen.
The communication layer includes network switches, data collectors, optical terminals and other network equipment used to connect with the station control layer, which are installed in the data acquisition box. The data acquisition box and bay layer equipment are installed nearby and can be installed on the wall. The communication layer is a connecting physical layer, which is responsible for transmitting the information of the bay layer device to the station control layer and issuing the command of the station control layer to the bay layer device.
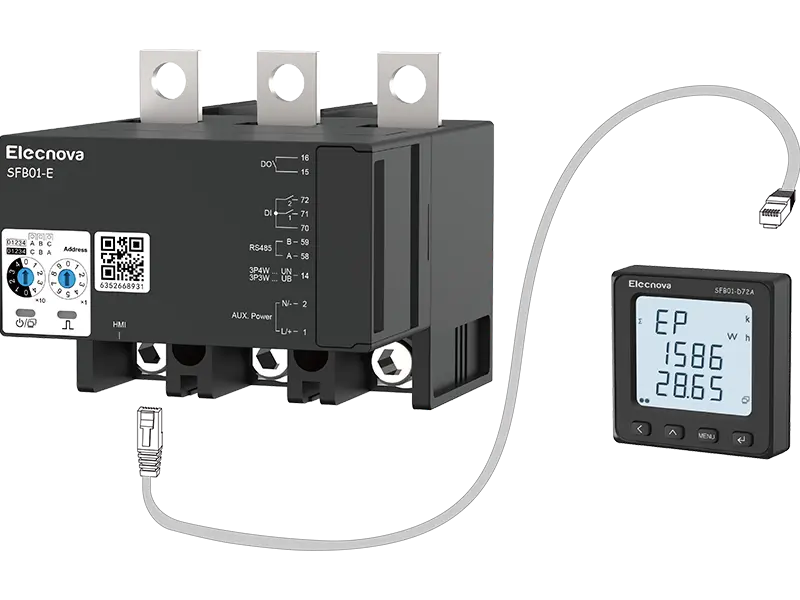
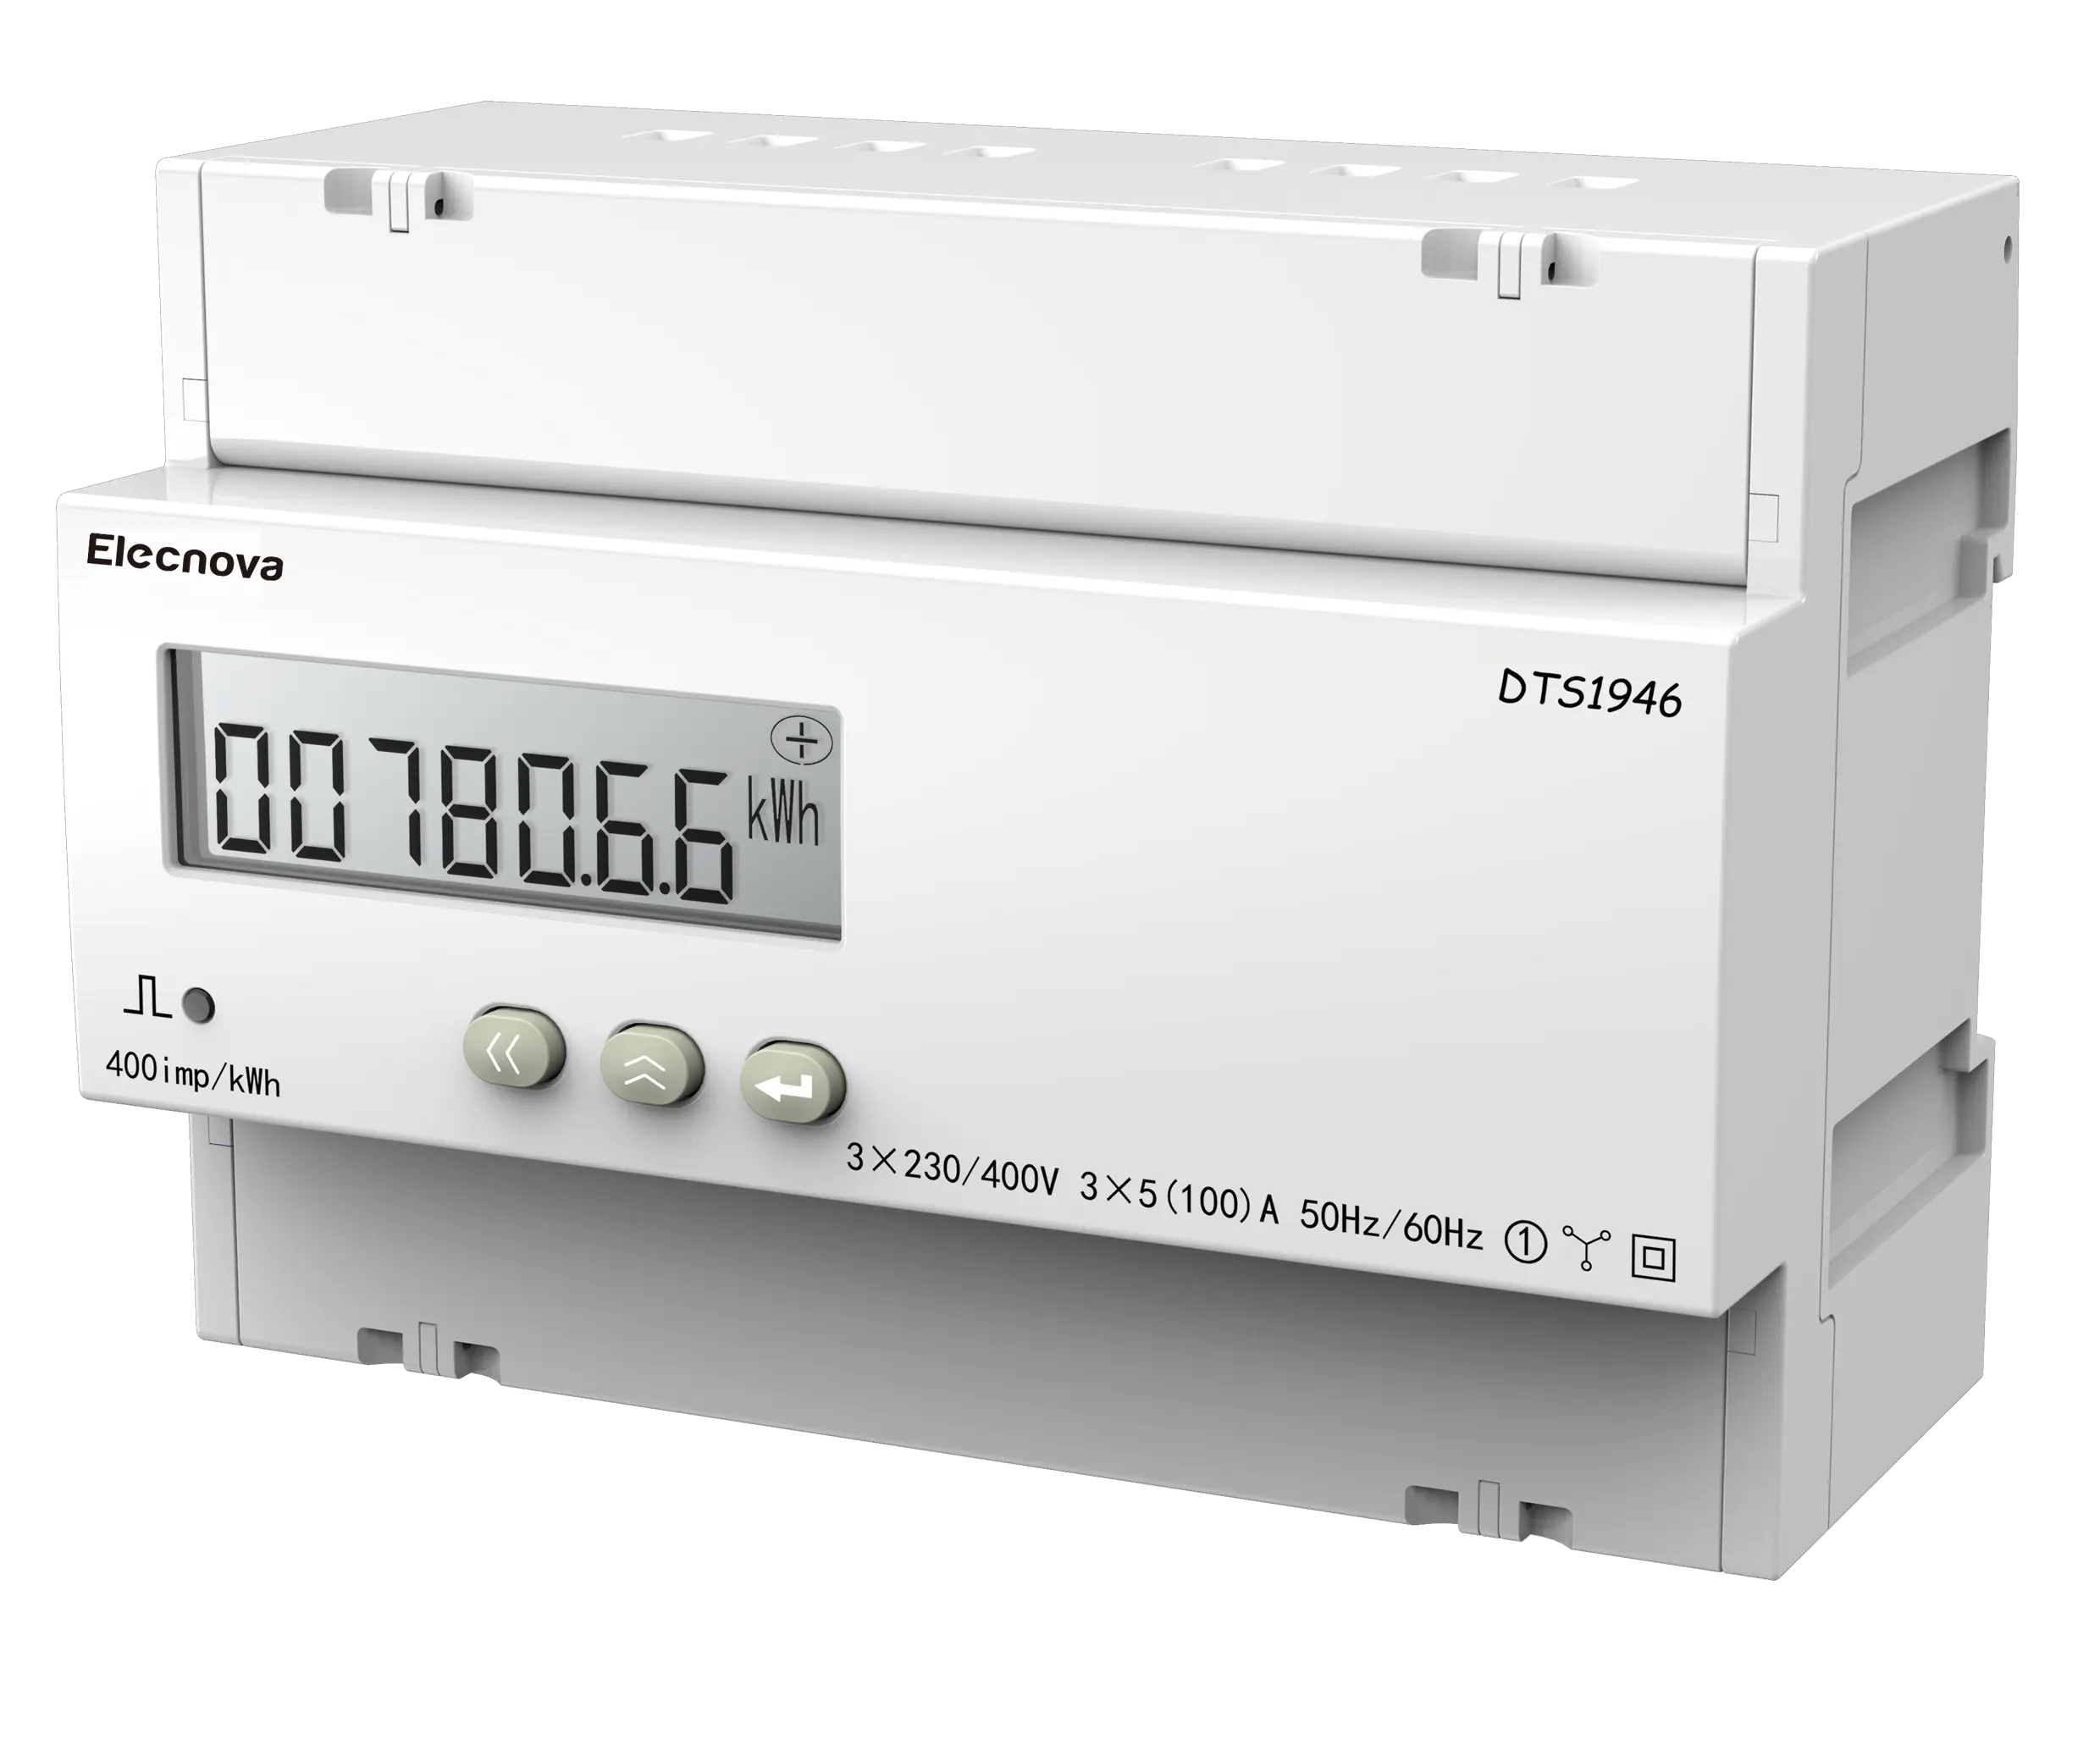
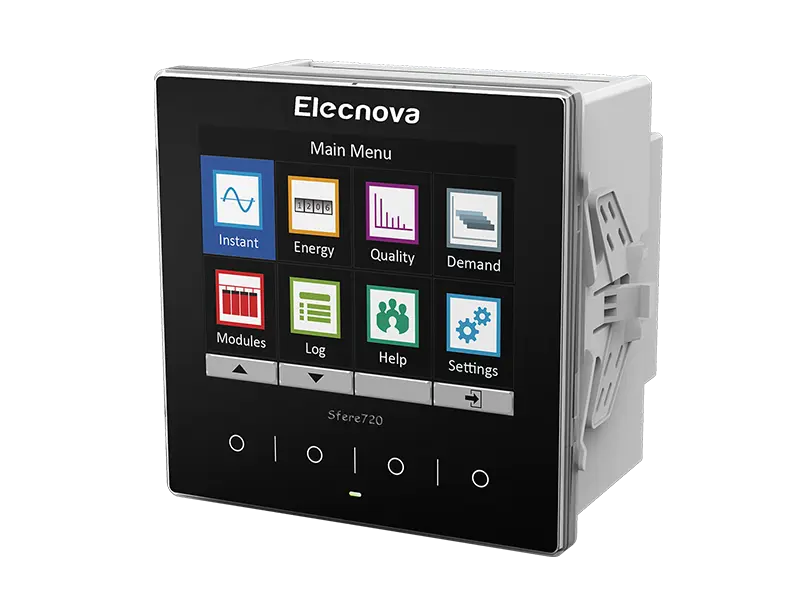
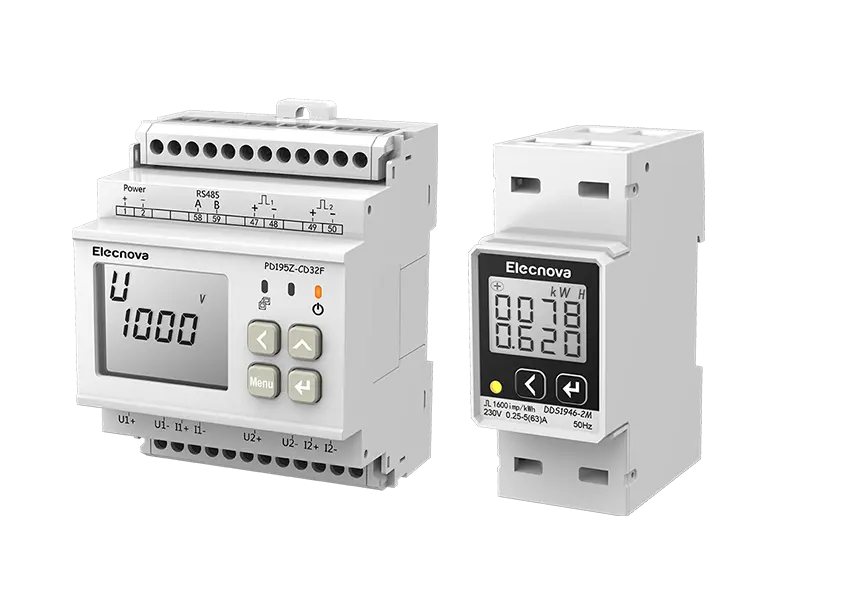
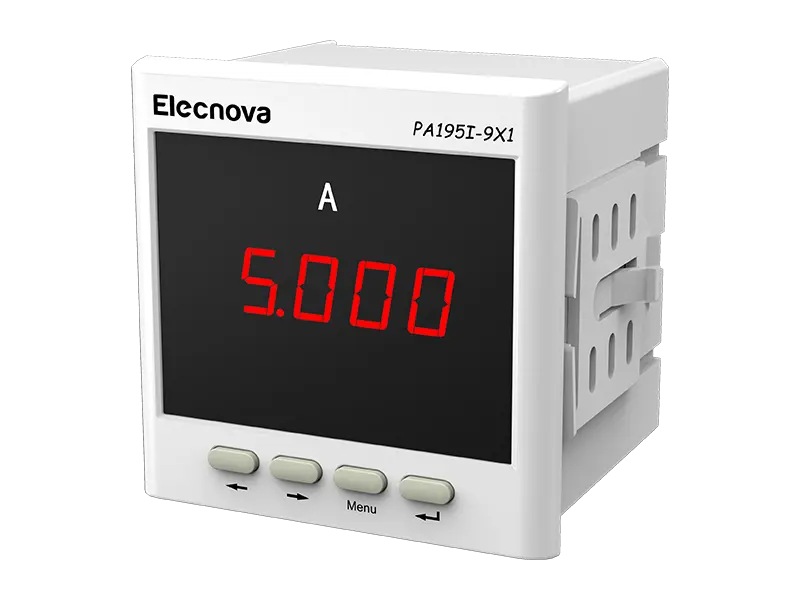
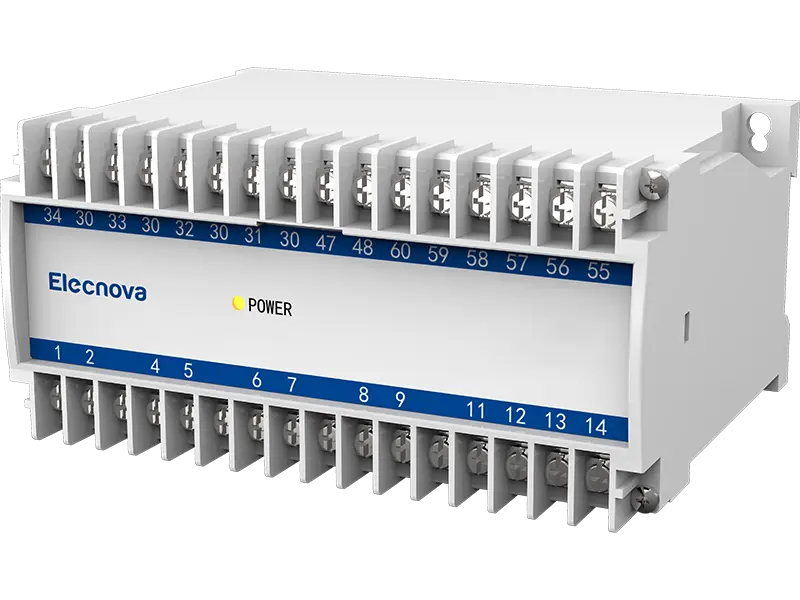
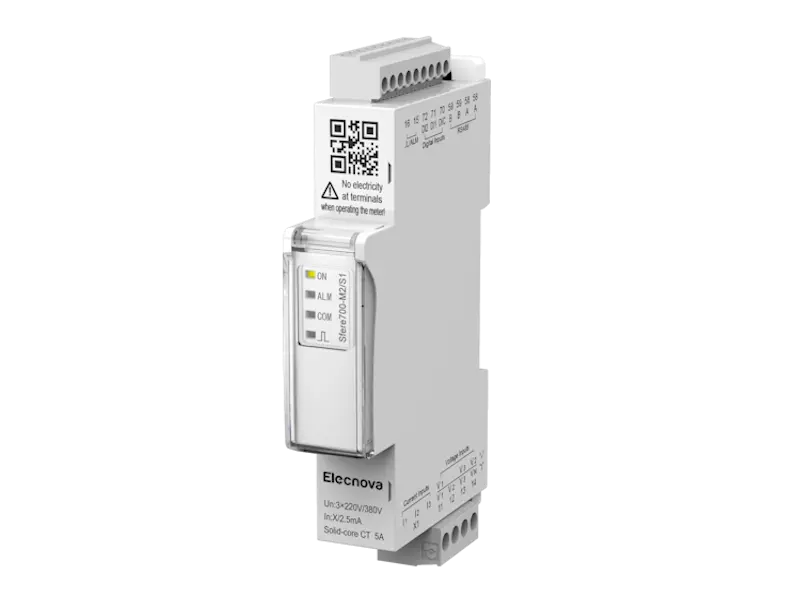
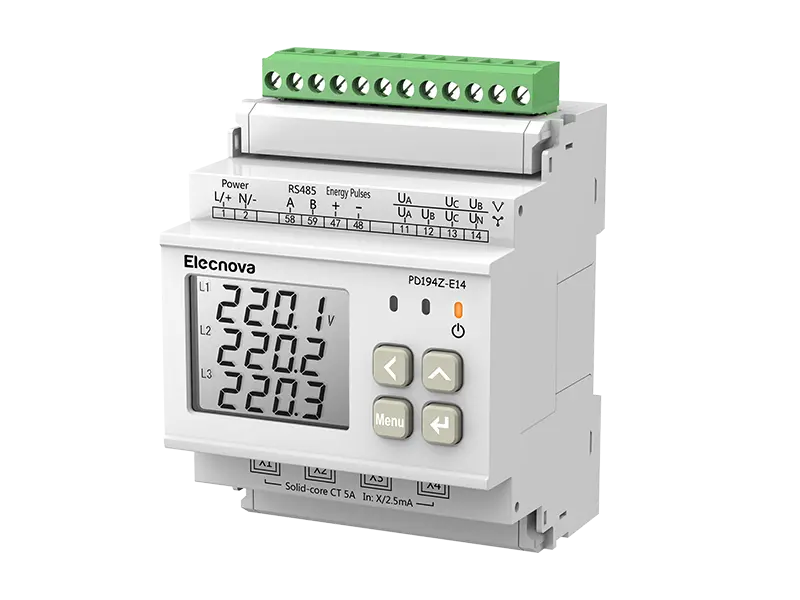
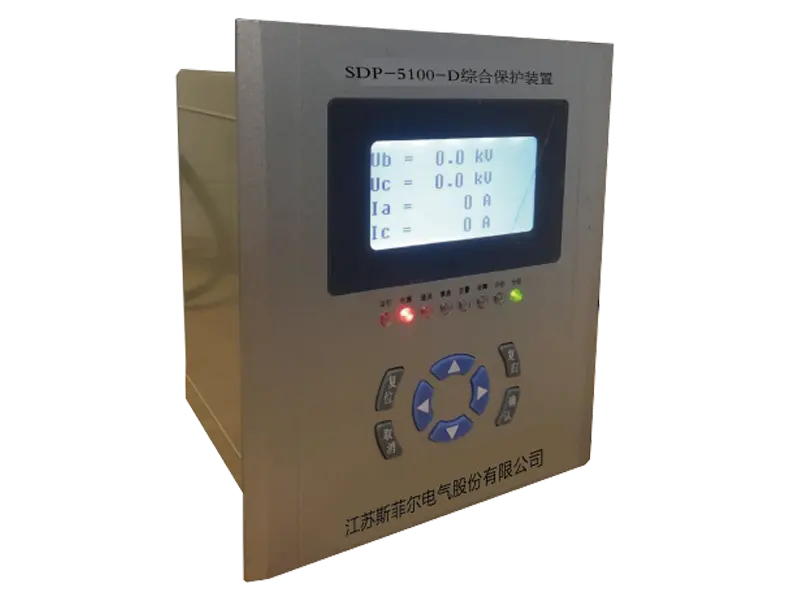
Equipment layer equipment includes microcomputer protection device, multi-function power meter, water meter, gas meter, heat meter and other intelligent equipment installed on high and low voltage switchgear and distribution box, such as DC panel, transformer temperature controller, etc. The field equipment layer equipment is connected to the data collector equipment through the field bus, and the data collector is transferred to the station control management layer through Ethernet.
Monitoring function
System operation monitoring
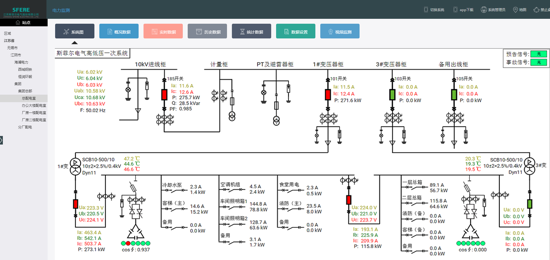
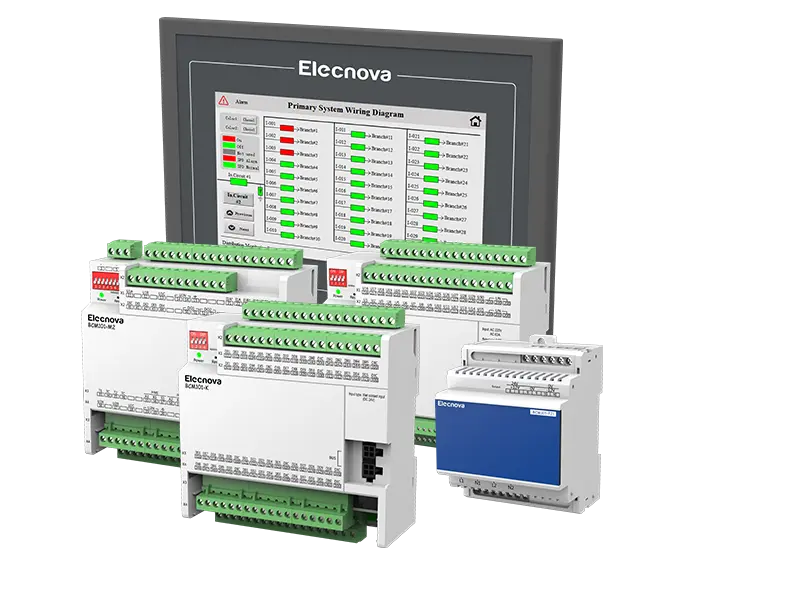
Support the primary diagram display mode of the power transformation and distribution system in the data center, and collect and display the current, voltage, power, power factor and other electrical parameters of the high and low voltage circuits in real time. Various display colors are provided to display the opening and closing status of the switch, and audible and visual alarms are also provided. Provide intuitive graphics and data for operation and maintenance personnel.
Overview of electricity consumption
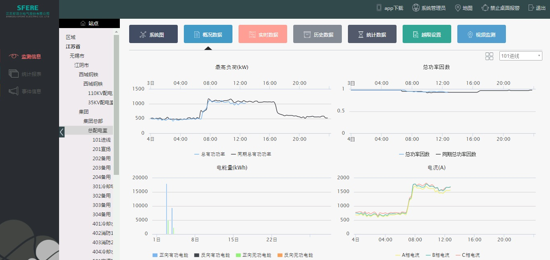
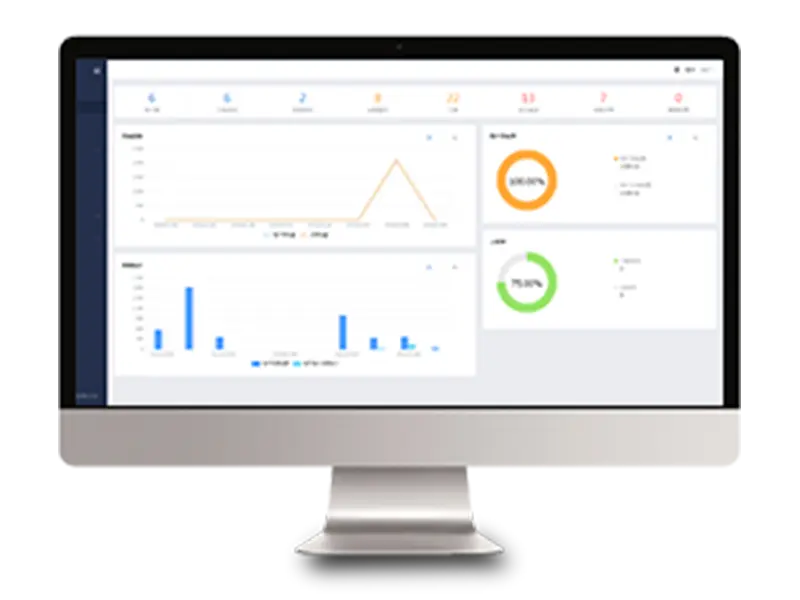
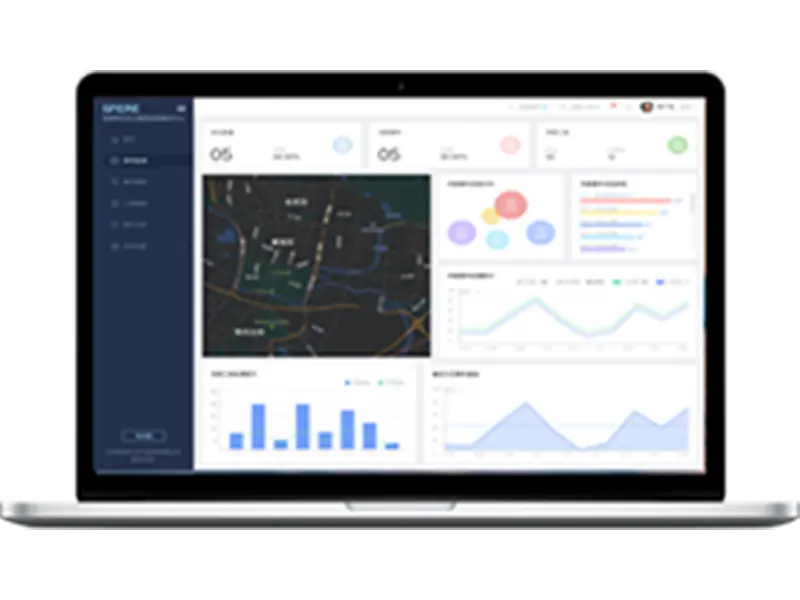
Quickly understand the overall operation status of the power distribution in the data center, and conveniently browse the power, current, power factor change curve of each distribution circuit and the daily electric energy consumption bar chart. The comparison of electricity consumption in the same period can help the operation and maintenance personnel intuitively grasp the power consumption trend.

Trend curve analysis
The trend curve system can continuously monitor the operating parameters of the equipment in real time, such as power load and waveform capture at the moment of fault occurrence, help users dynamically analyze the historical changes of various data, and provide powerful data basis for the operation and maintenance management personnel to predict the parameter changes and future trends of the power supply system in a certain period of time.
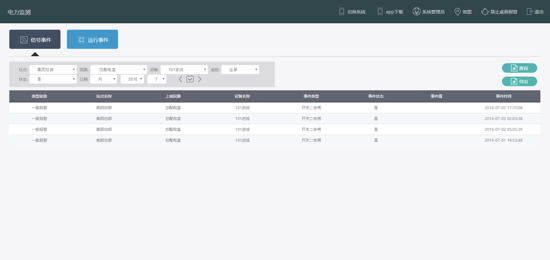
Event sequence record and query
Monitor the alarm status, tripping status, switch displacement status and other status event information of each circuit in real time, send out obvious audible and visual alarm for alarm and tripping monitoring events, and record all events occurred in the system, so as to provide data guarantee for detailed analysis of operators.
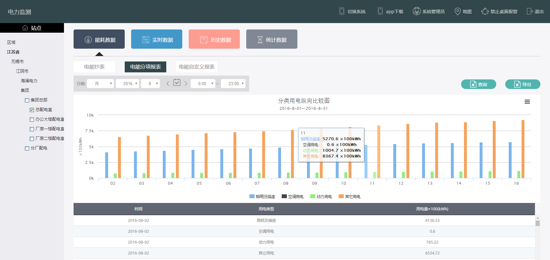
Graphical analysis management
The system can generate various operation statistics dynamic image systems, such as voltage bar chart, pie chart and phase angle chart, and can graphically analyze the real-time changes of various grid parameters; It can also set alarm and tripping limits for sensitive power parameters that affect the normal operation of the system load, send alarm in advance or automatically send tripping output control to ensure the reliability of the system.
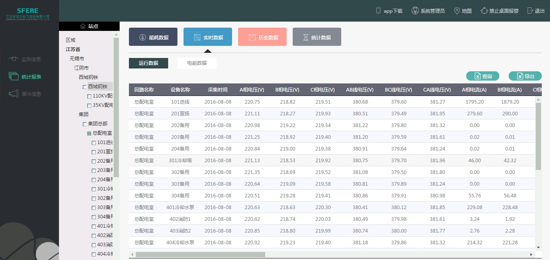
Real time data report system
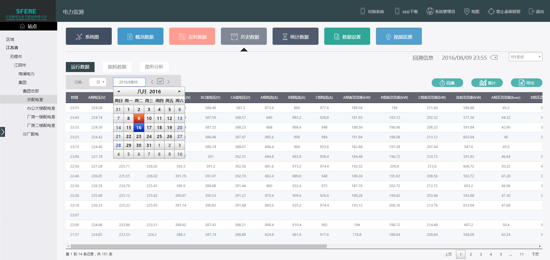
The real-time report system provides the operating system with real-time display of data and status in a unified table mode, which can dynamically compare and monitor each loop in real time. The real-time report supports exporting data in excel format, which is convenient for the second phase processing.
Historical Data Report Query
The historical report system can provide various historical data report queries, such as daily reports, monthly reports, quarterly reports, and annual reports. It can query various historical data, such as current, voltage, power load, and electric energy metering, and generate various statistical data to provide data support for user metering statistics, internal consumption analysis, and other needs.



 CN
CN EN
EN
 fr
fr  de
de  es
es  it
it  ru
ru  ar
ar  vi
vi  tr
tr  th
th 